
Industrial Process Engineering: How to Map Processes for Safer, More Efficient Plants




Process Mapping Is a Project Control Tool, Not a Documentation Exercise
For a project leader responsible for a cement line, glass furnace, waste-to-energy plant, refractory facility, or extrusion operation, industrial process engineering becomes valuable when it makes hidden operating dependencies visible before they turn into delays, safety events, or underperforming assets.
A useful process map does more than show equipment in sequence. It connects material condition, energy input, process chemistry, control logic, human intervention, emissions handling, and maintenance access. When those connections are understood early, a plant team can make better choices about scope, instrumentation, layout, automation, contingency capacity, and commissioning priorities.
The practical question is not whether every operation needs a detailed flow diagram. Most plants already have some version of one. The question is whether the map explains how the plant actually behaves under normal production, reduced throughput, feed variability, start-up, shutdown, and abnormal conditions. A simplified map can support a presentation; it rarely supports a major engineering decision.
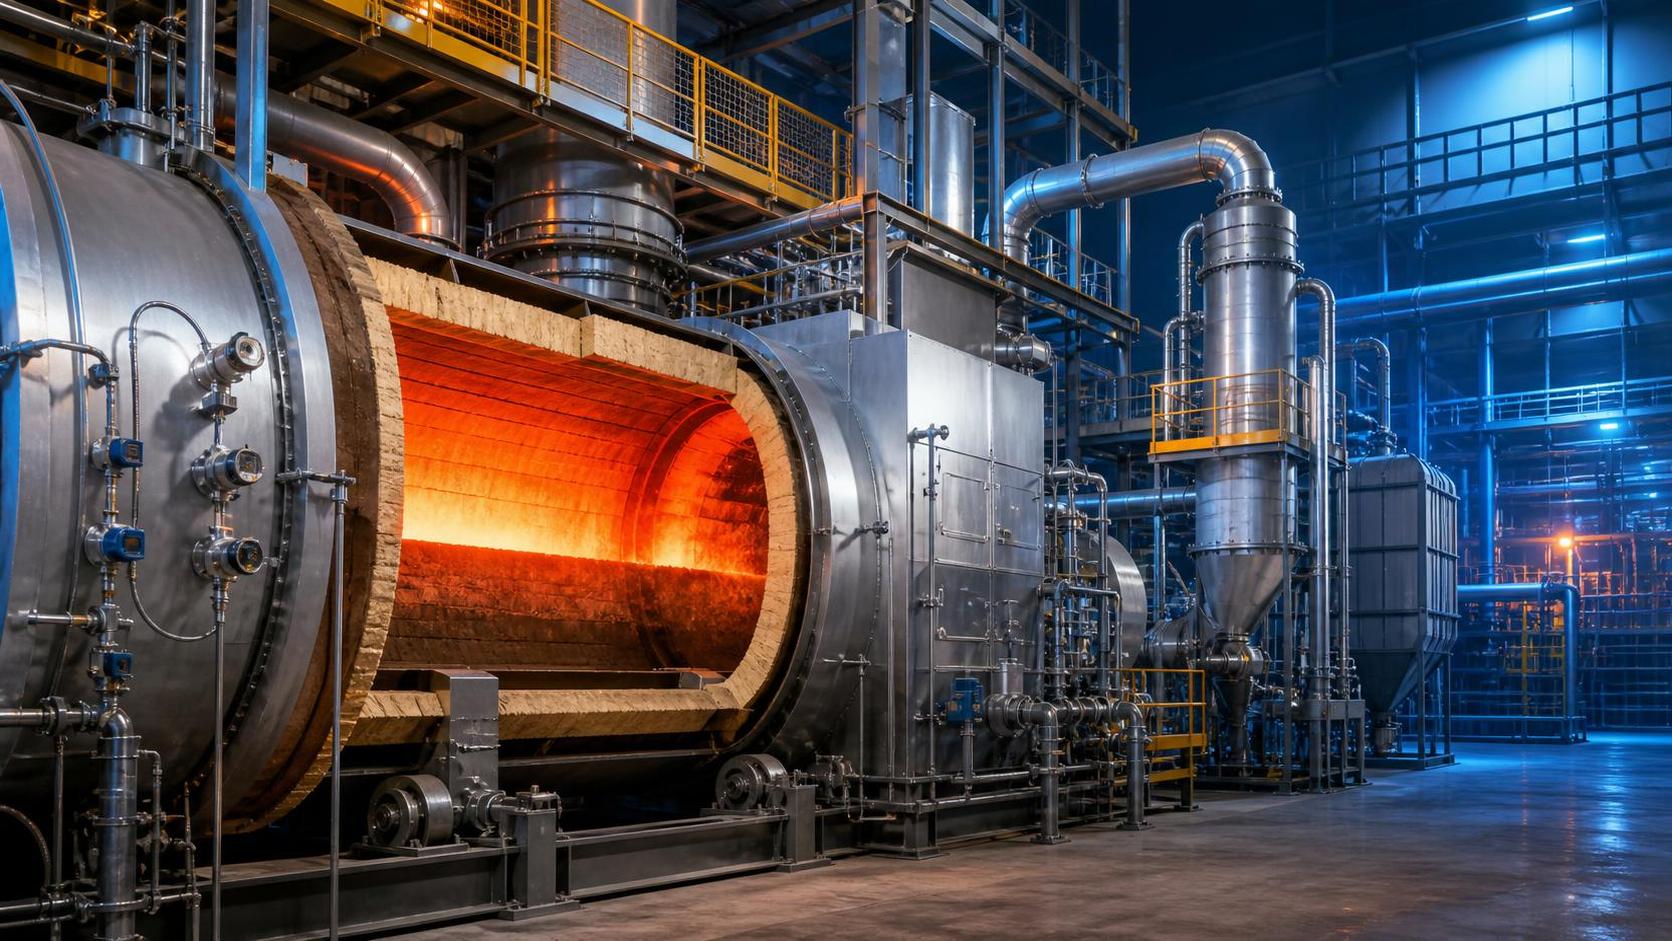
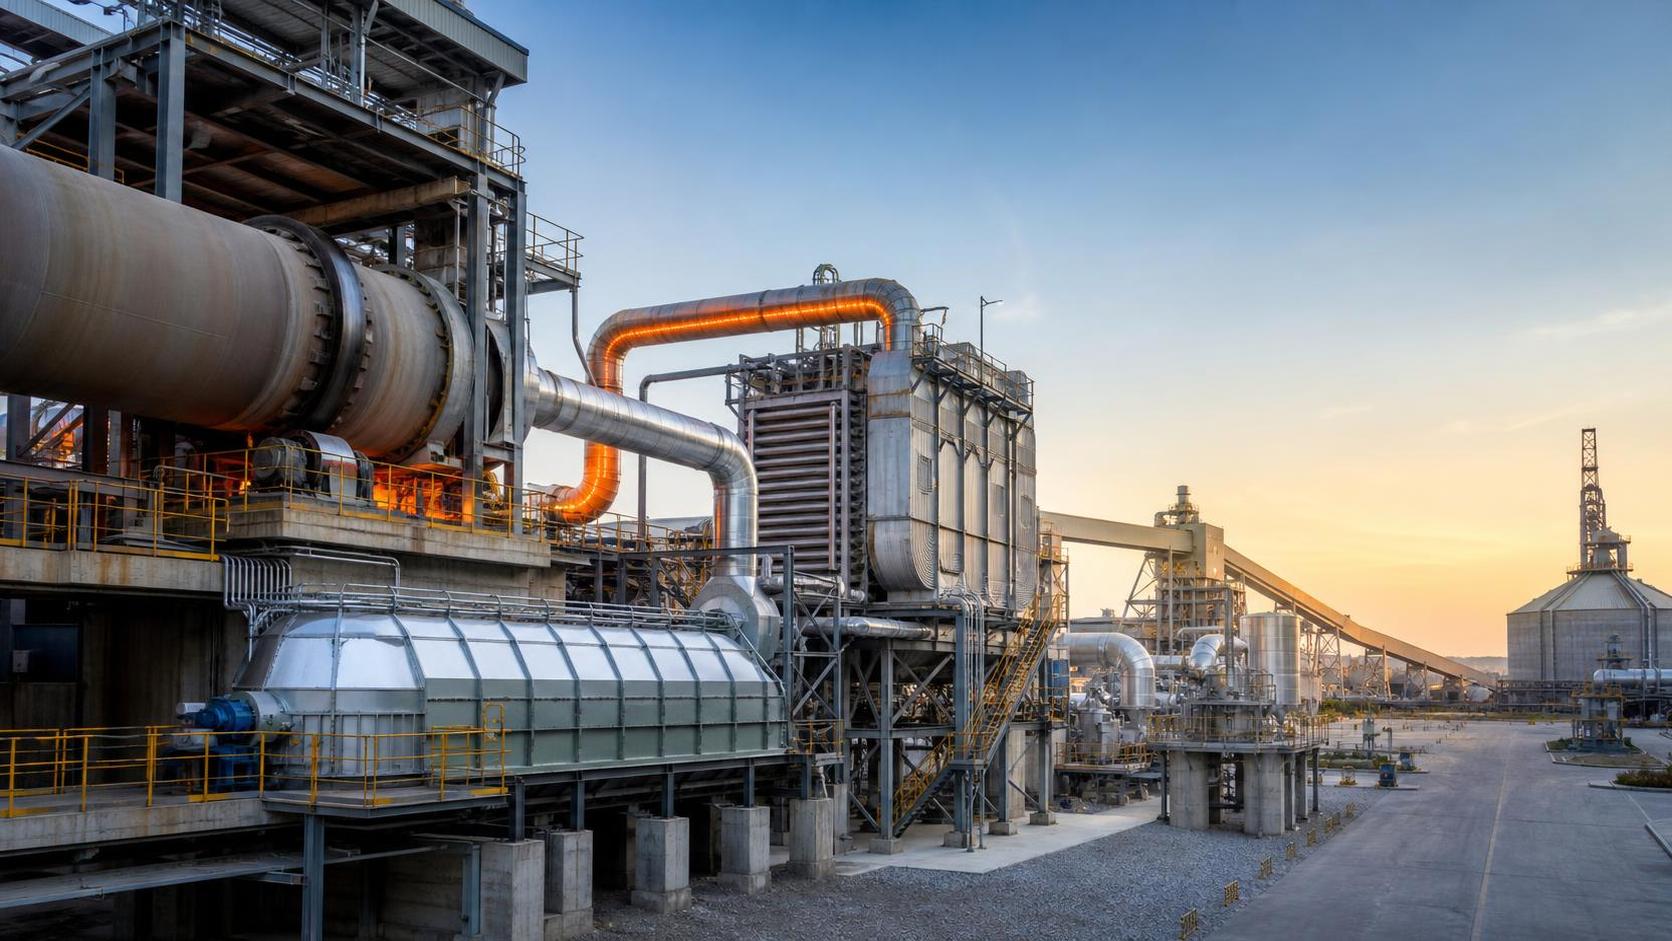
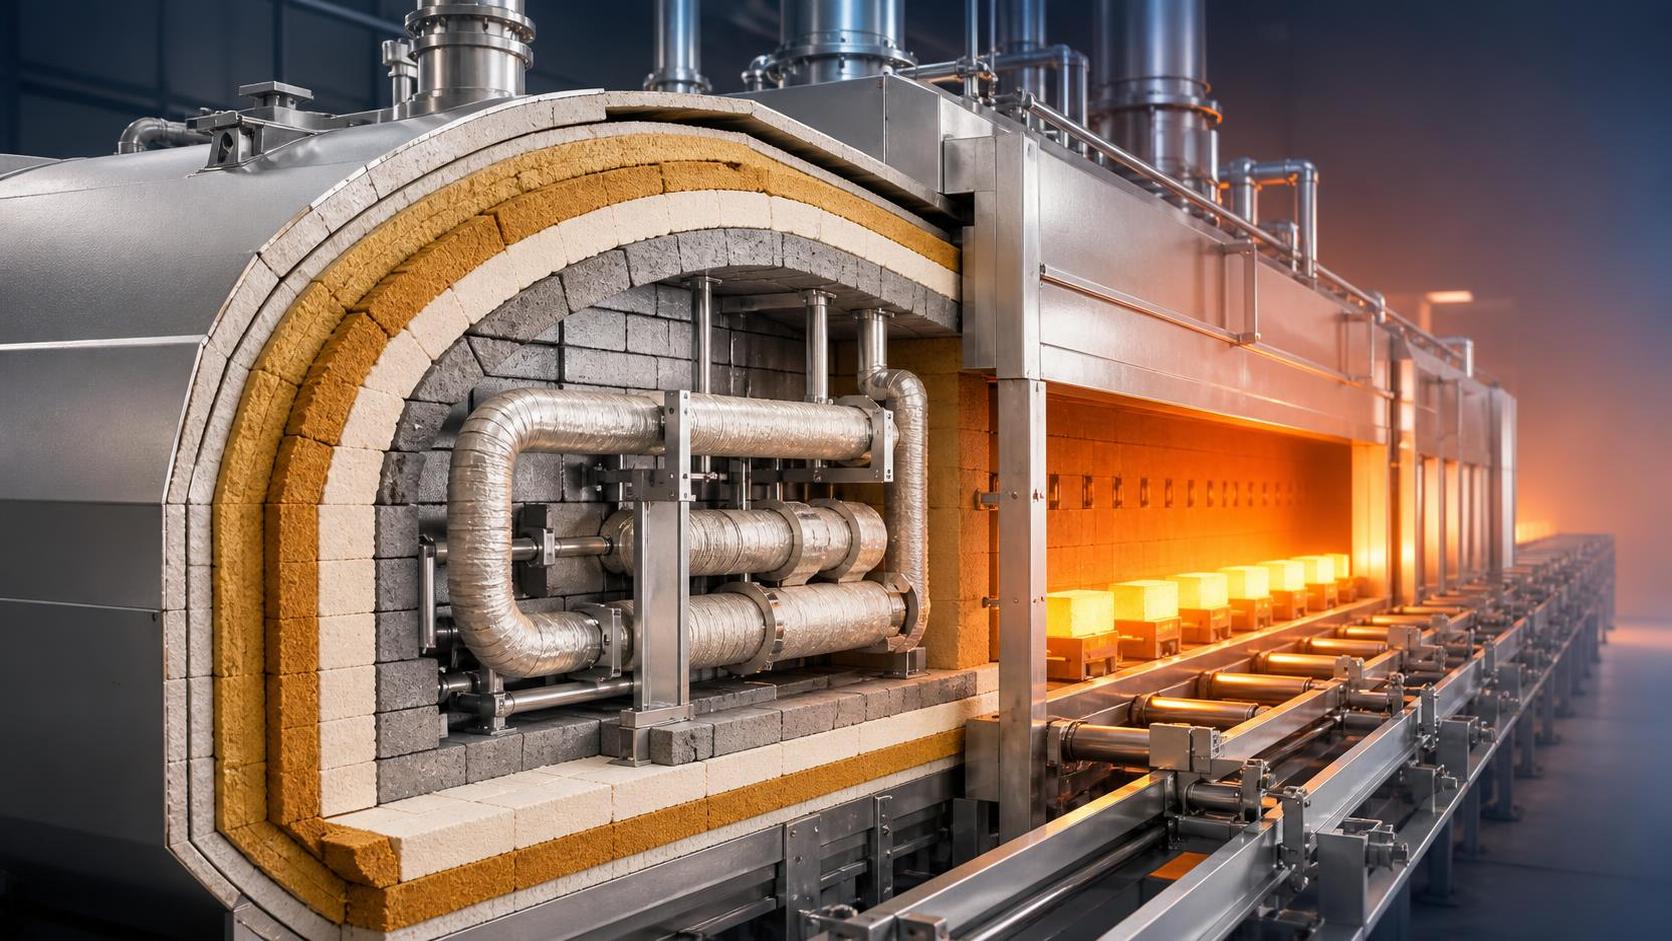
For high-temperature operations in particular, process mapping should begin before equipment selections become difficult to change. A kiln, furnace, incinerator, dryer, cooler, dust collection train, or extrusion line may appear as a discrete package in a project plan. In operation, its performance depends on upstream preparation, fuel characteristics, air balance, refractory condition, control response, downstream handling, and the capability of operators to intervene safely.
Start With the Decisions the Map Must Support
Teams often lose time by trying to map everything at the same level of detail. A process map should instead be built around a defined decision. Is the project assessing a capacity expansion? Preparing for alternative fuel use? Reducing thermal energy demand? Addressing recurring dust excursions? Replacing an aging furnace control system? The intended decision determines what must be mapped and what can remain at a higher level.
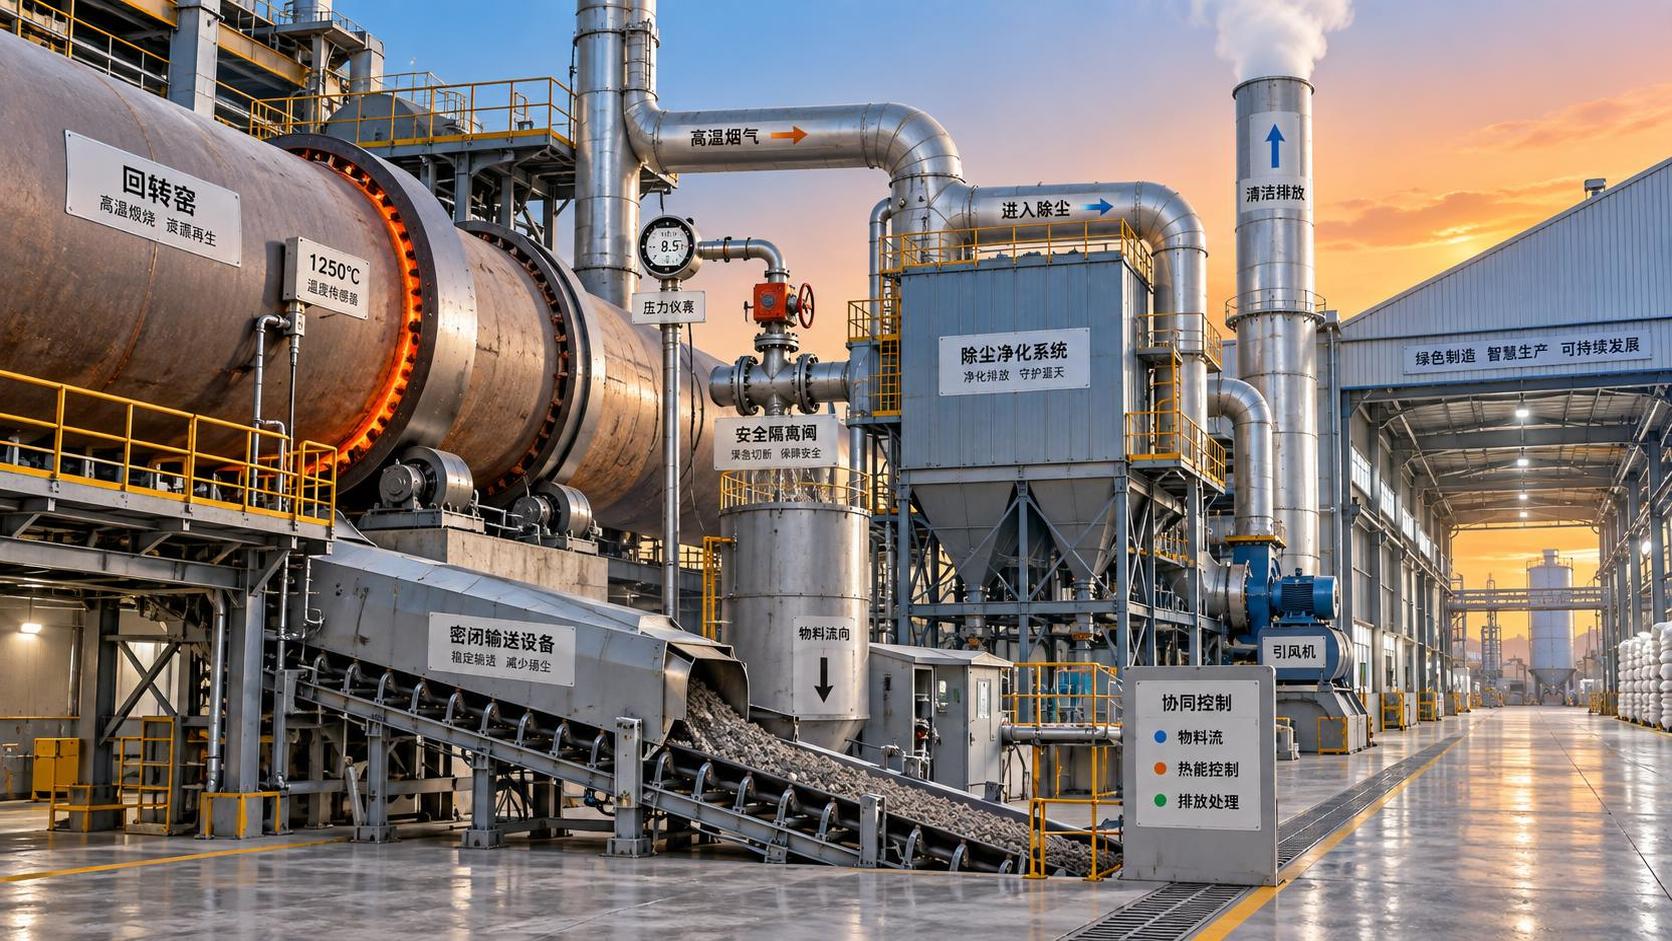
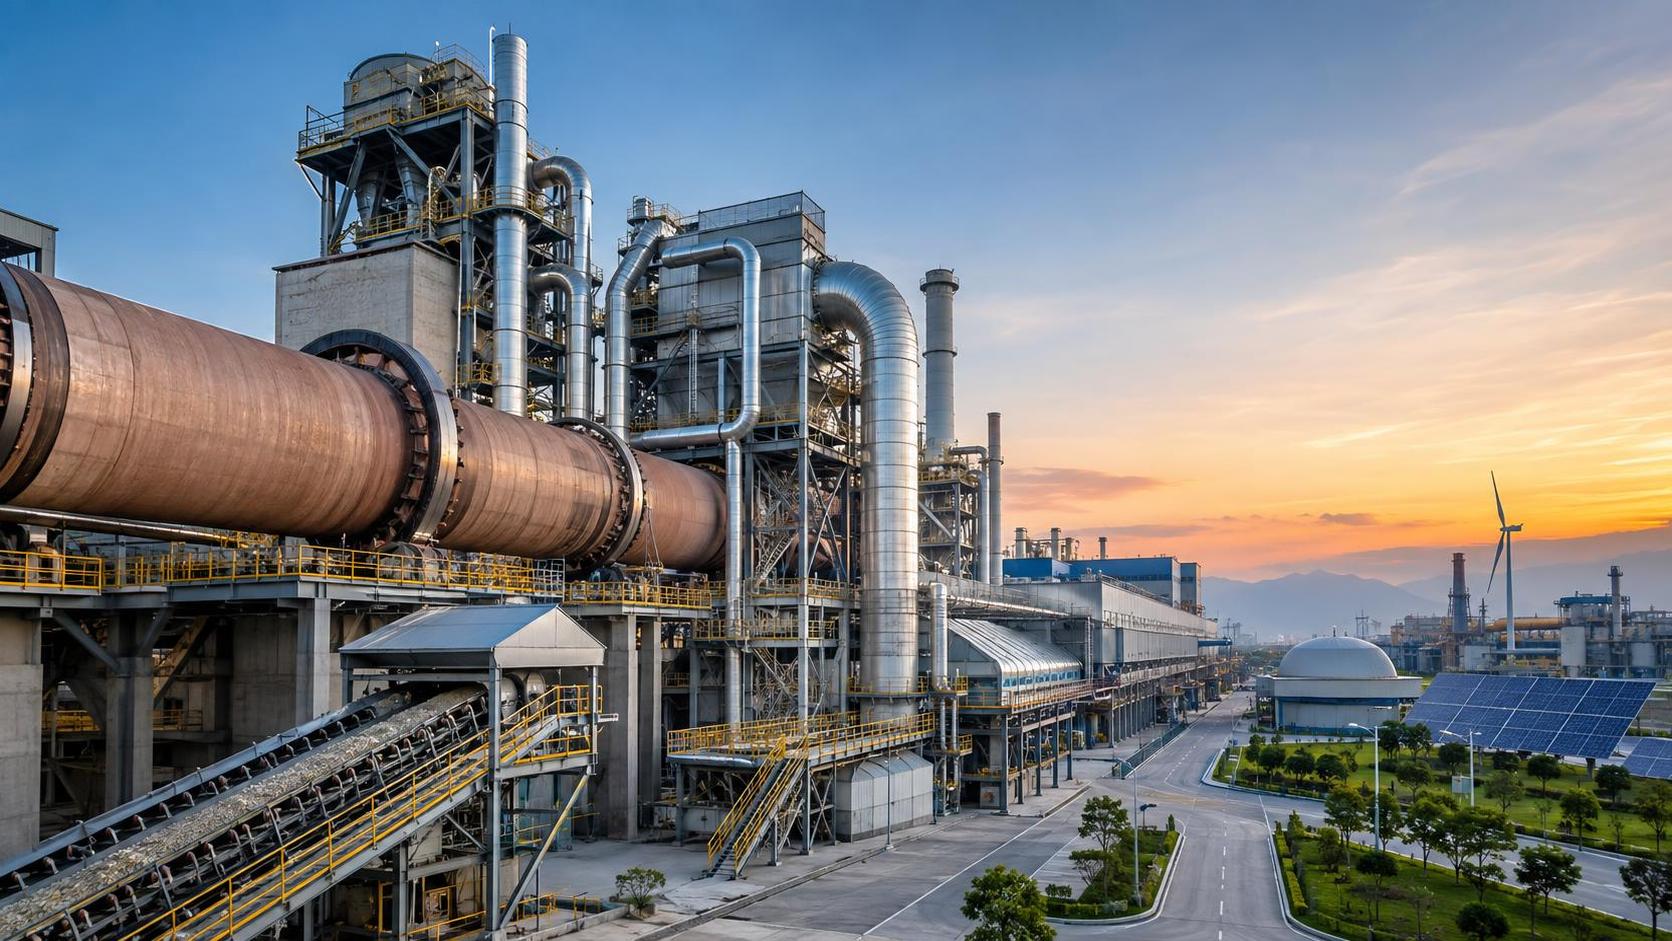
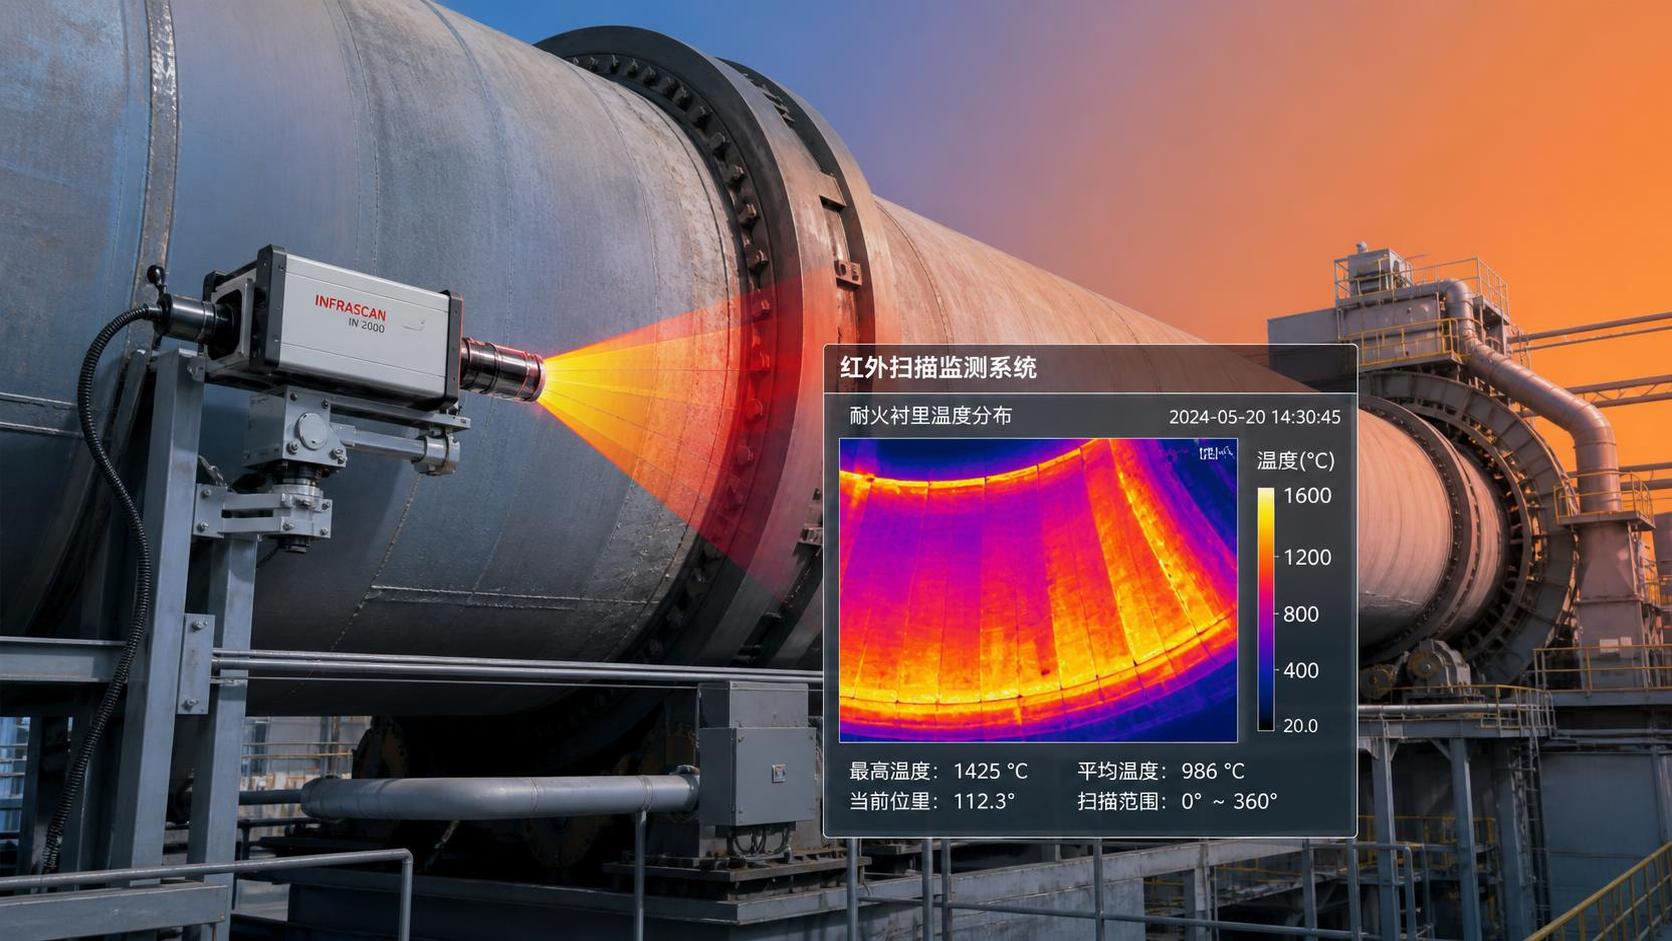
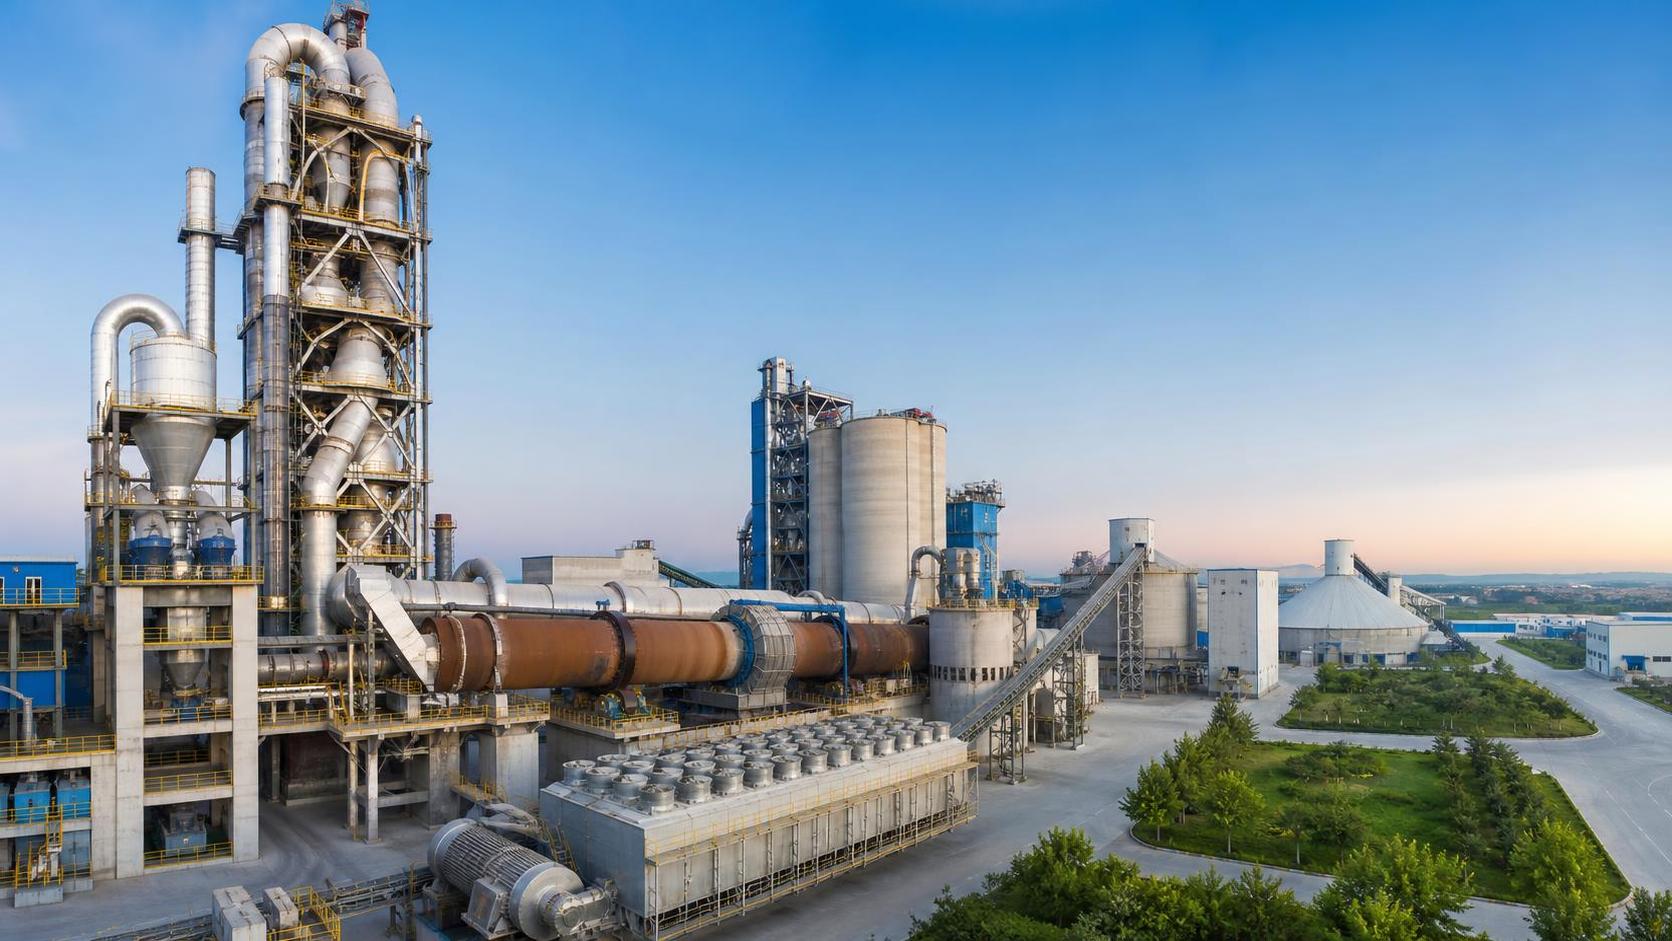
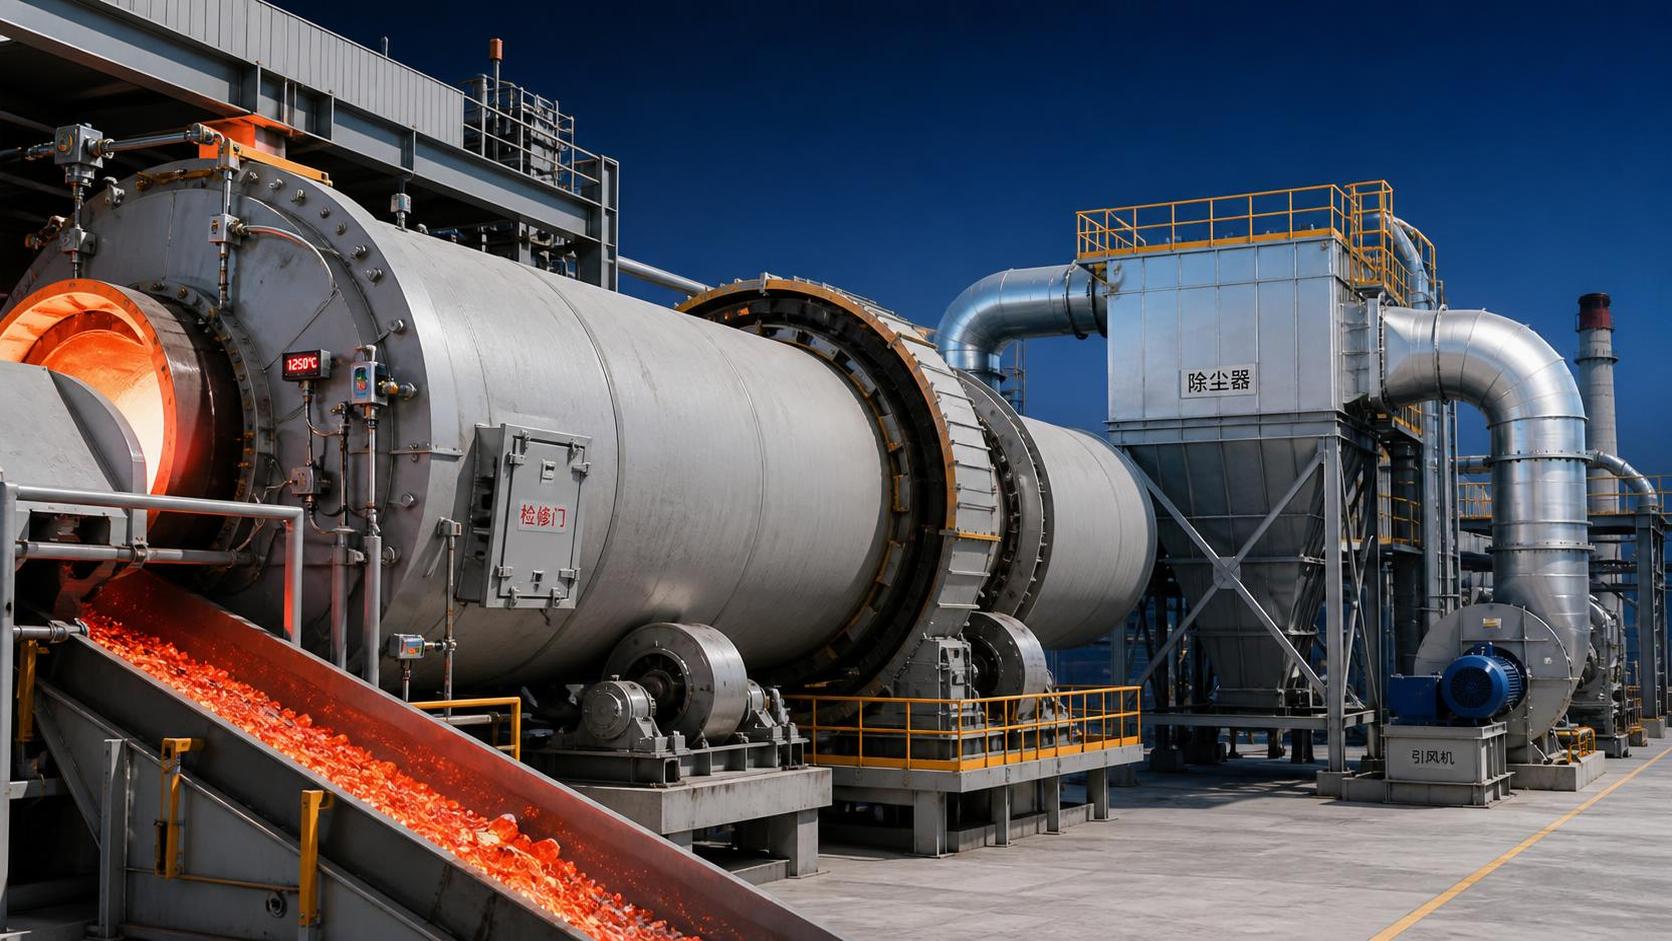
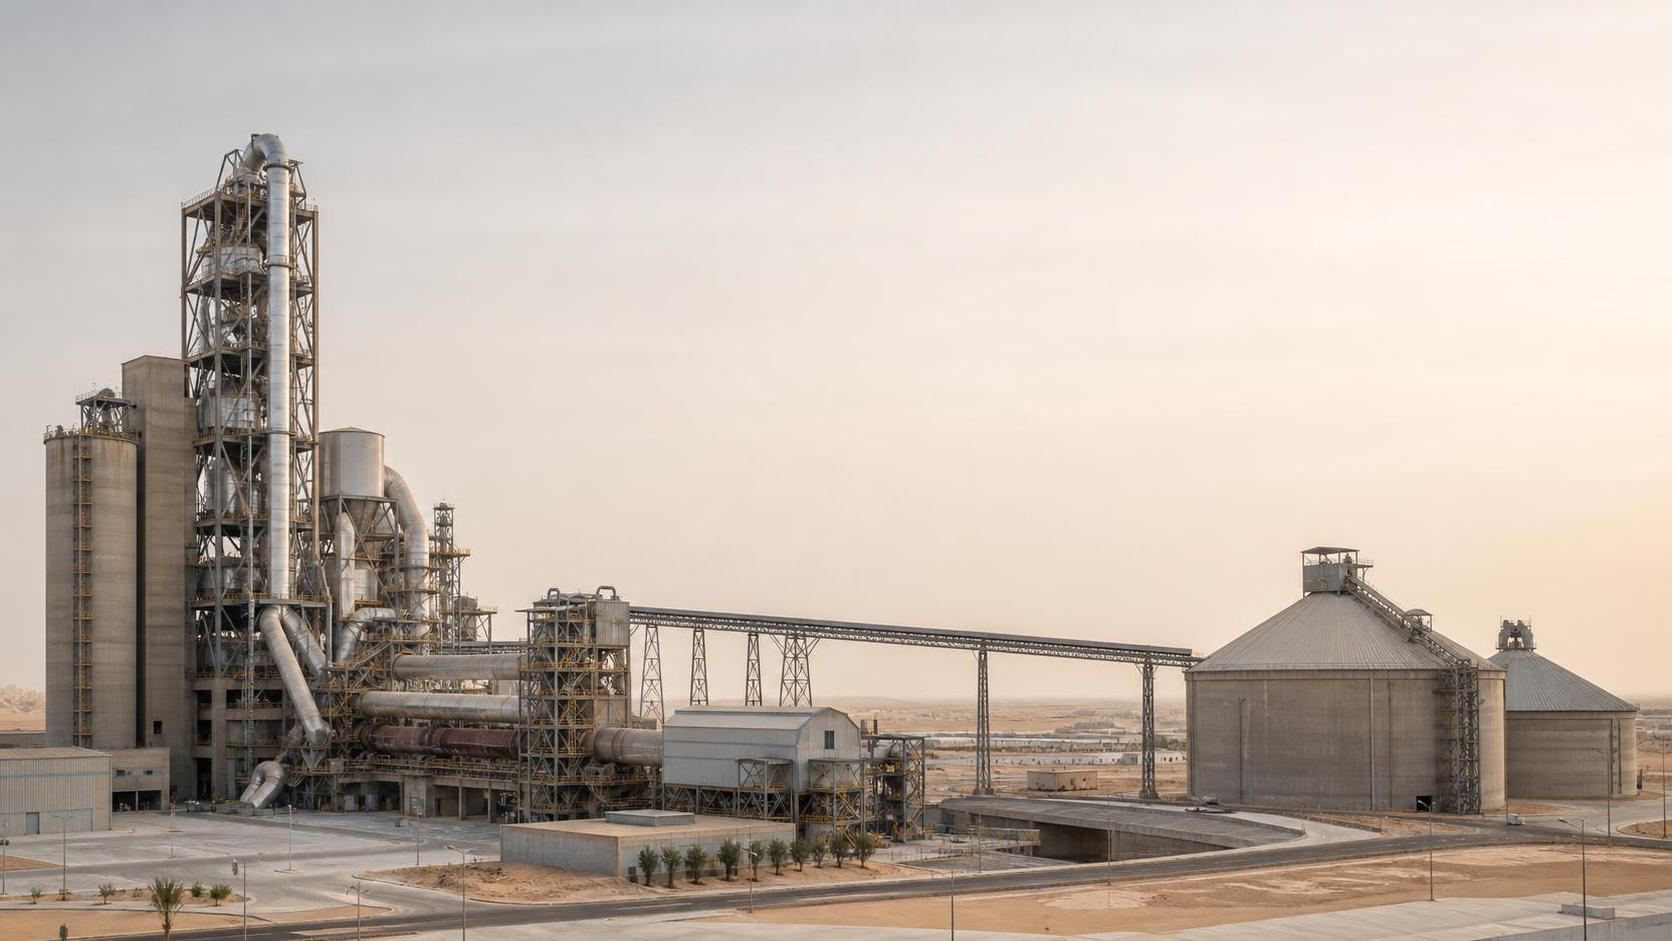
For example, a project aimed at increasing output from a rotary kiln system cannot stop at the kiln feed rate and final clinker discharge. It needs to show raw material preparation, moisture variability, preheater loading, fuel delivery, combustion air, gas treatment, cooler performance, conveying limits, and the points at which operators override automatic controls. Otherwise, the project may identify a nominal bottleneck while shifting the actual constraint to a fan, filter, cooler, or material-handling system.
A good working brief for industrial process engineering usually answers four questions before the mapping work begins:
- What operating outcome is being improved: throughput, energy intensity, product quality, emissions stability, availability, safety, or a combination?
- What boundaries are included: one machine, one production area, the full production line, or shared site utilities?
- Which conditions must the design tolerate, including feed changes, fuel changes, seasonal conditions, planned maintenance, and upset scenarios?
- Which decision will depend on the findings: capital approval, equipment specification, control-system design, operating procedure, or risk reduction plan?
These questions prevent a common failure mode: producing a technically polished diagram that cannot resolve the decision that prompted the project.
Map Flows in Layers, Beginning With Physical Reality
The first layer is the physical flow of materials. It should identify what enters each stage, its condition at entry, how it is transformed, where it is held or mixed, and what leaves. “Material” includes more than the principal feedstock. It may include additives, recycled material, packaging residues, alternative fuels, process water, compressed air, dust returns, bypass streams, rejects, and waste residues.
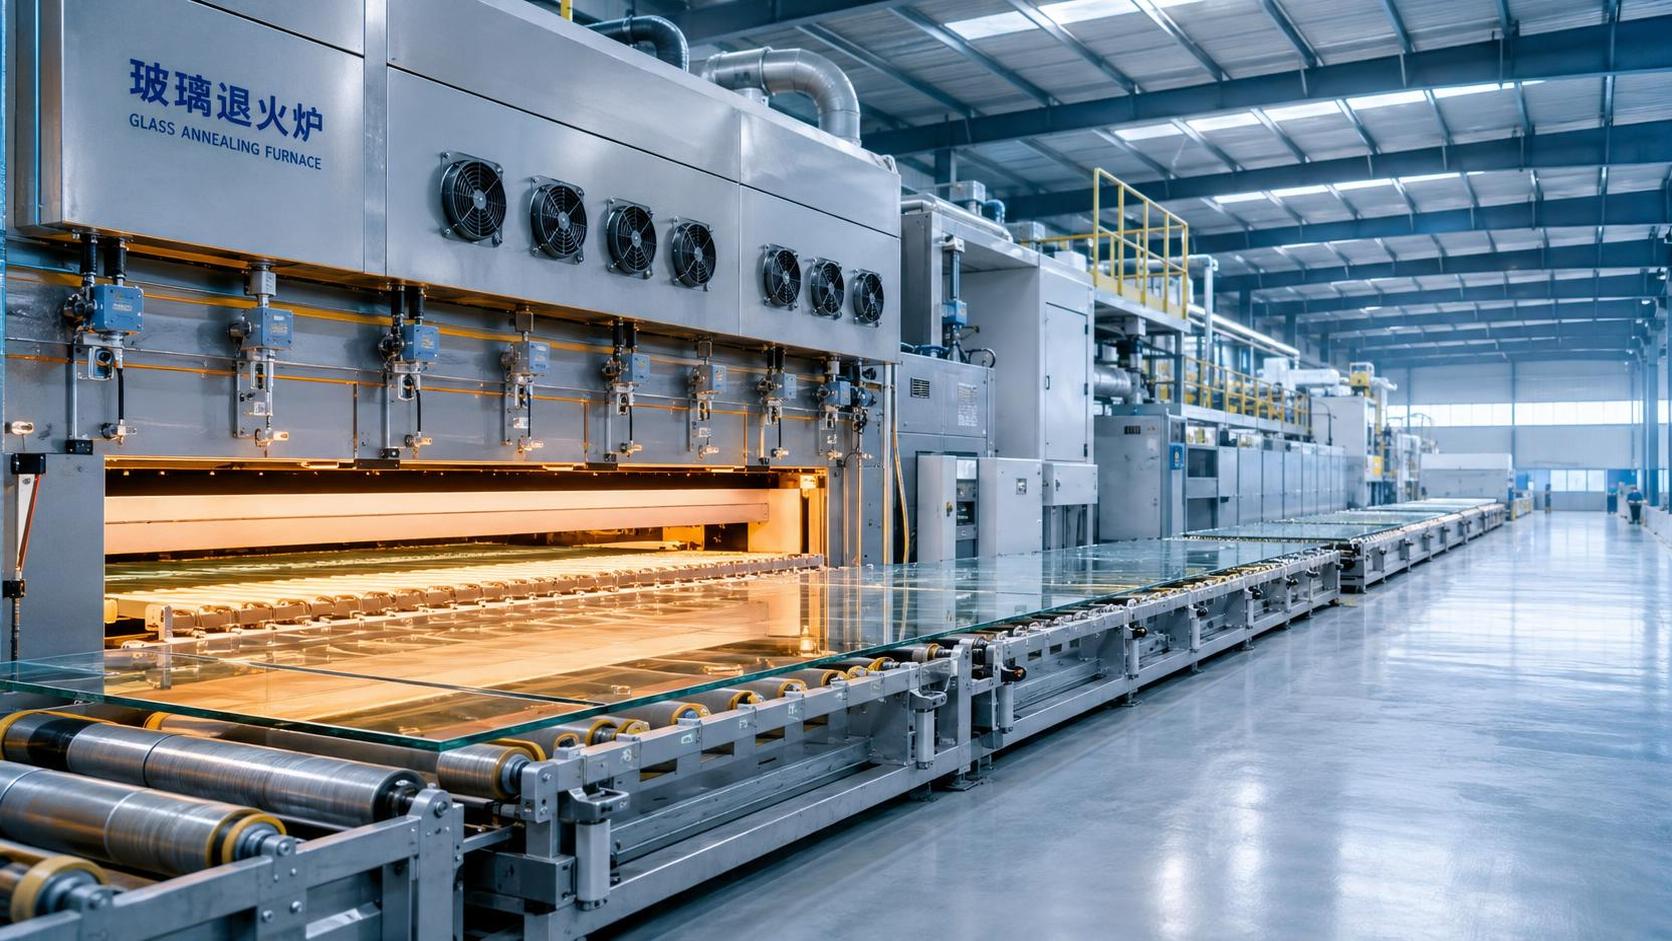
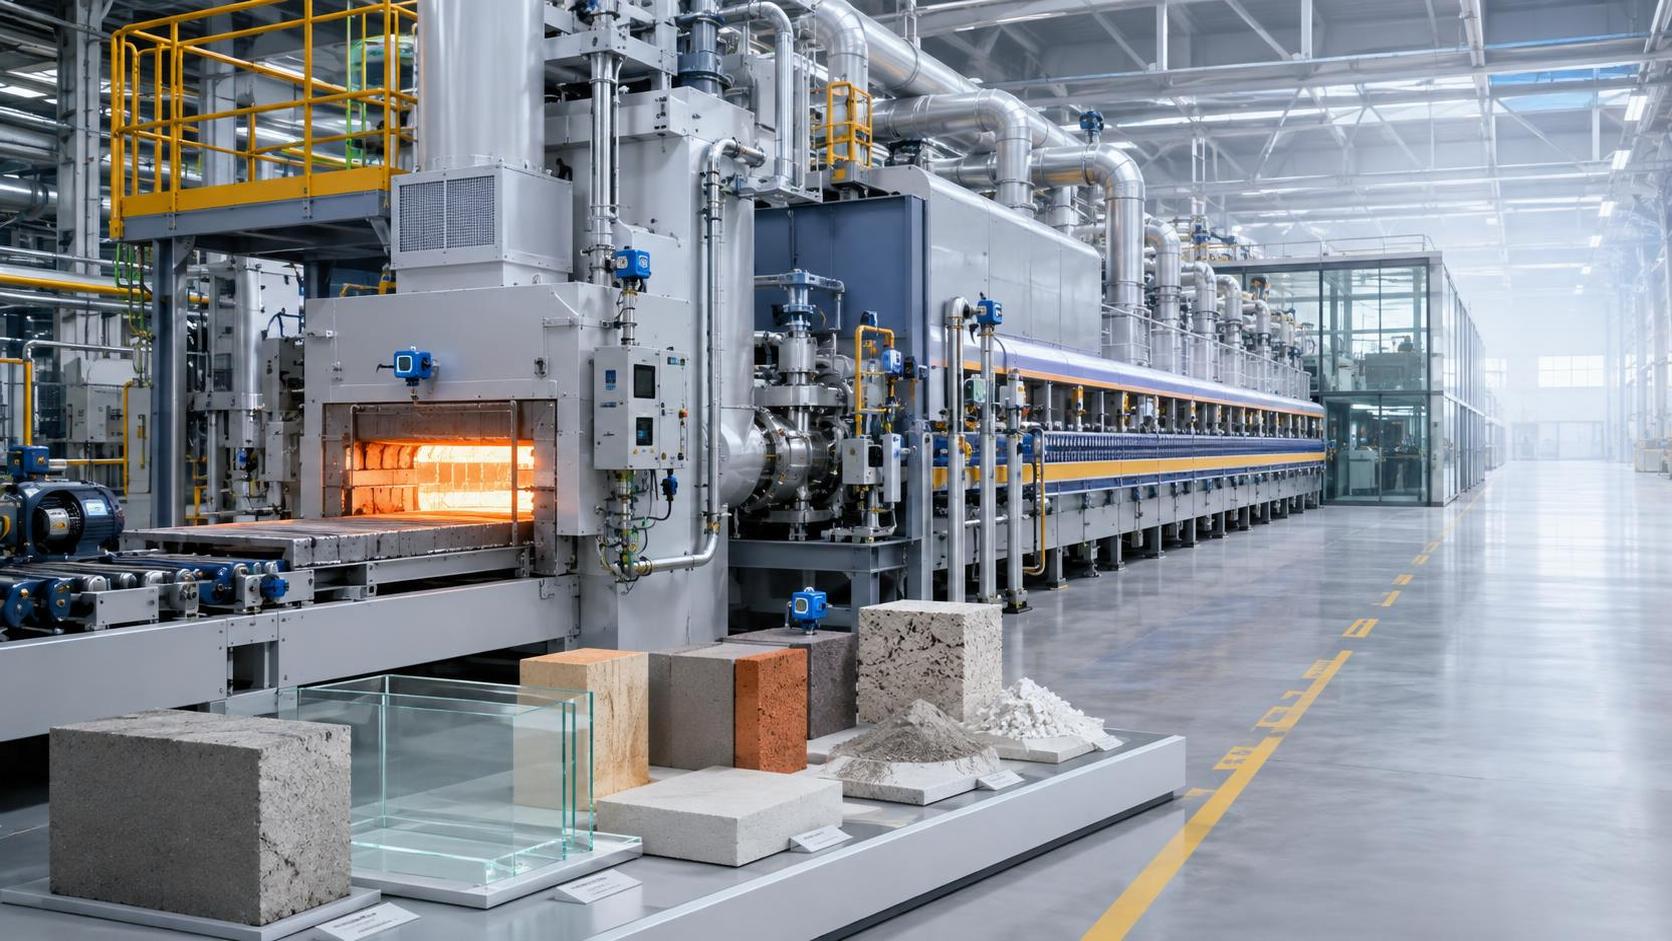
In a glass operation, batch materials, cullet quality, furnace atmosphere, molten glass temperature, forming conditions, and annealing stages all influence the final product. In a refractory plant, the composition and particle-size distribution of raw materials, binder addition, forming pressure, drying profile, firing curve, and cooling sequence may all affect consistency. A map that treats these as isolated departments will miss where variation accumulates.
The second layer is energy. High-temperature plants should trace fuel, electrical loads, combustion air, recovered heat, exhaust gases, cooling loads, and heat losses through the process. This does not require a full thermodynamic model at the first stage, but it does require enough detail to expose material-energy interactions.
For instance, reducing fuel consumption in a kiln may appear to be a burner optimization task. The map may show that raw feed moisture, false air infiltration, excess oxygen, unstable feed chemistry, cooler air temperature, or refractory heat loss has a larger influence on fuel demand. The resulting project scope may be broader, but it will be more credible than a narrowly specified upgrade with limited operating impact.
The third layer is information and control. At each critical process transition, the team should identify what is measured, how frequently it is measured, who sees the information, what action follows, and how long the process can remain outside its preferred operating window. This is where drawings often become much more useful to project managers.
A pressure transmitter, temperature sensor, gas analyzer, belt scale, vibration monitor, laboratory result, or operator inspection has value only when its role in a decision is clear. If an operator receives a warning but has no reliable adjustment available, the plant has detection without control. If a control loop adjusts a process variable based on a delayed or unrepresentative measurement, automation may add instability rather than reduce it.
Identify the Handoffs Where Projects Commonly Underestimate Risk
The most consequential risks are often found at interfaces: where material changes state, where one operating area hands responsibility to another, or where automated control gives way to manual action. These handoffs deserve more attention than the obvious major equipment.
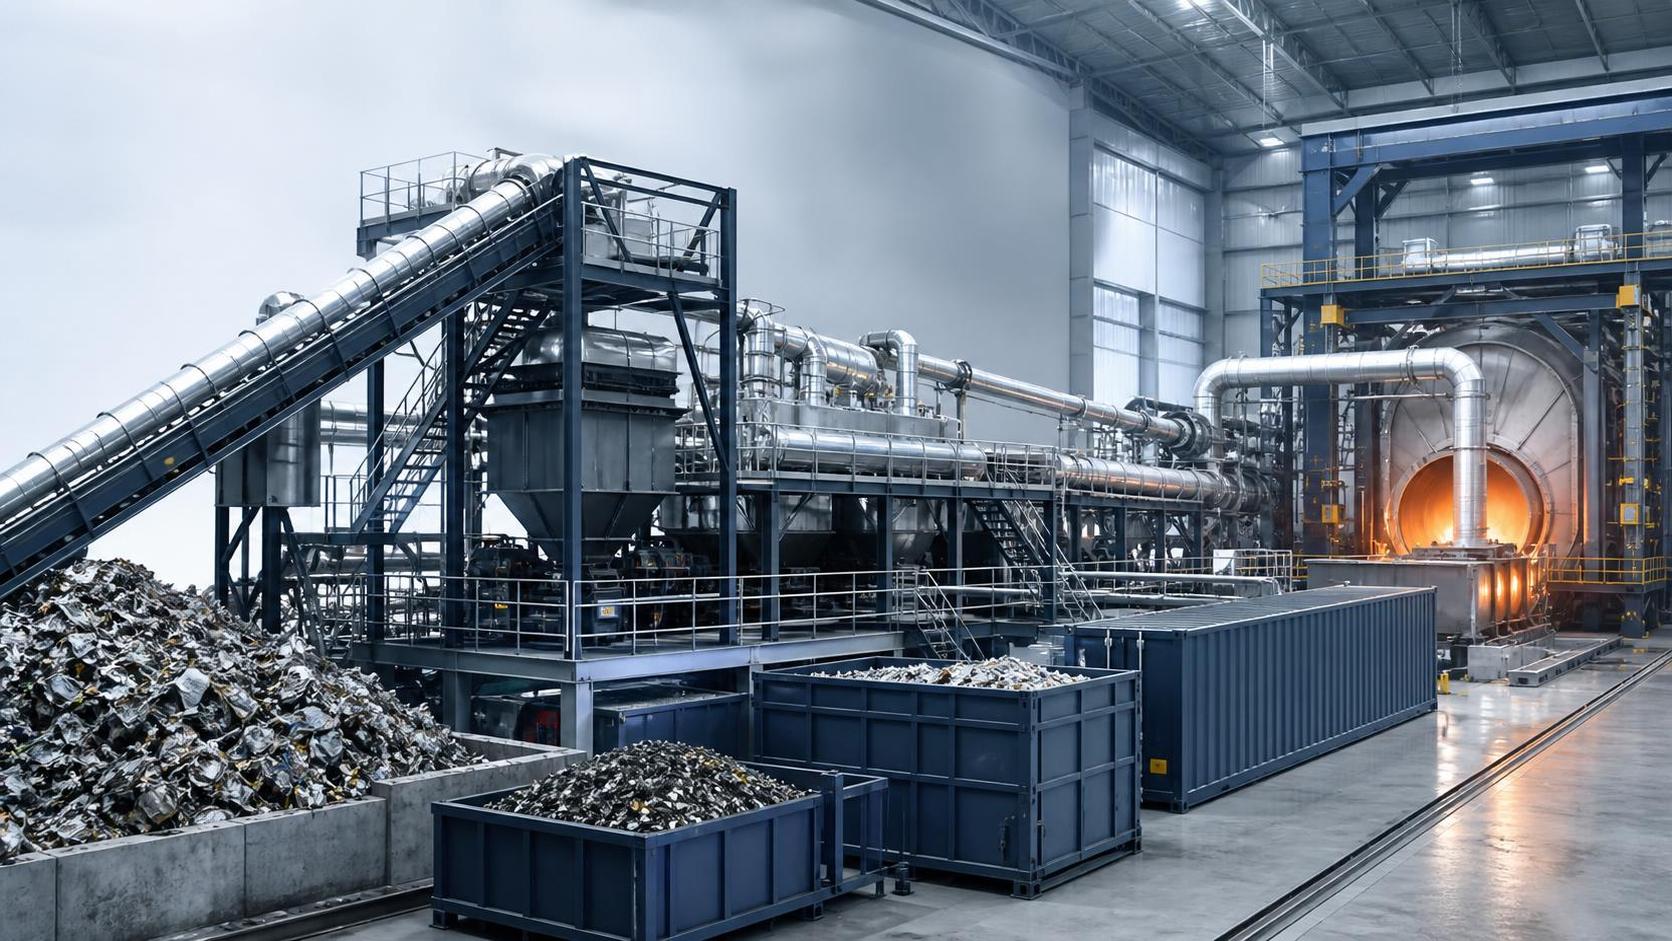
Consider an incineration process. Waste reception and blending determine the heating value and physical characteristics of the feed. Feed preparation affects how consistently material reaches the furnace. Furnace temperature and residence conditions influence combustion quality. Flue-gas treatment depends on the characteristics of the gas leaving the combustion stage. Ash handling must manage material that can remain hot, abrasive, or chemically challenging. A map that begins at the furnace inlet and ends at the stack may overlook the conditions that make emissions control difficult in the first place.
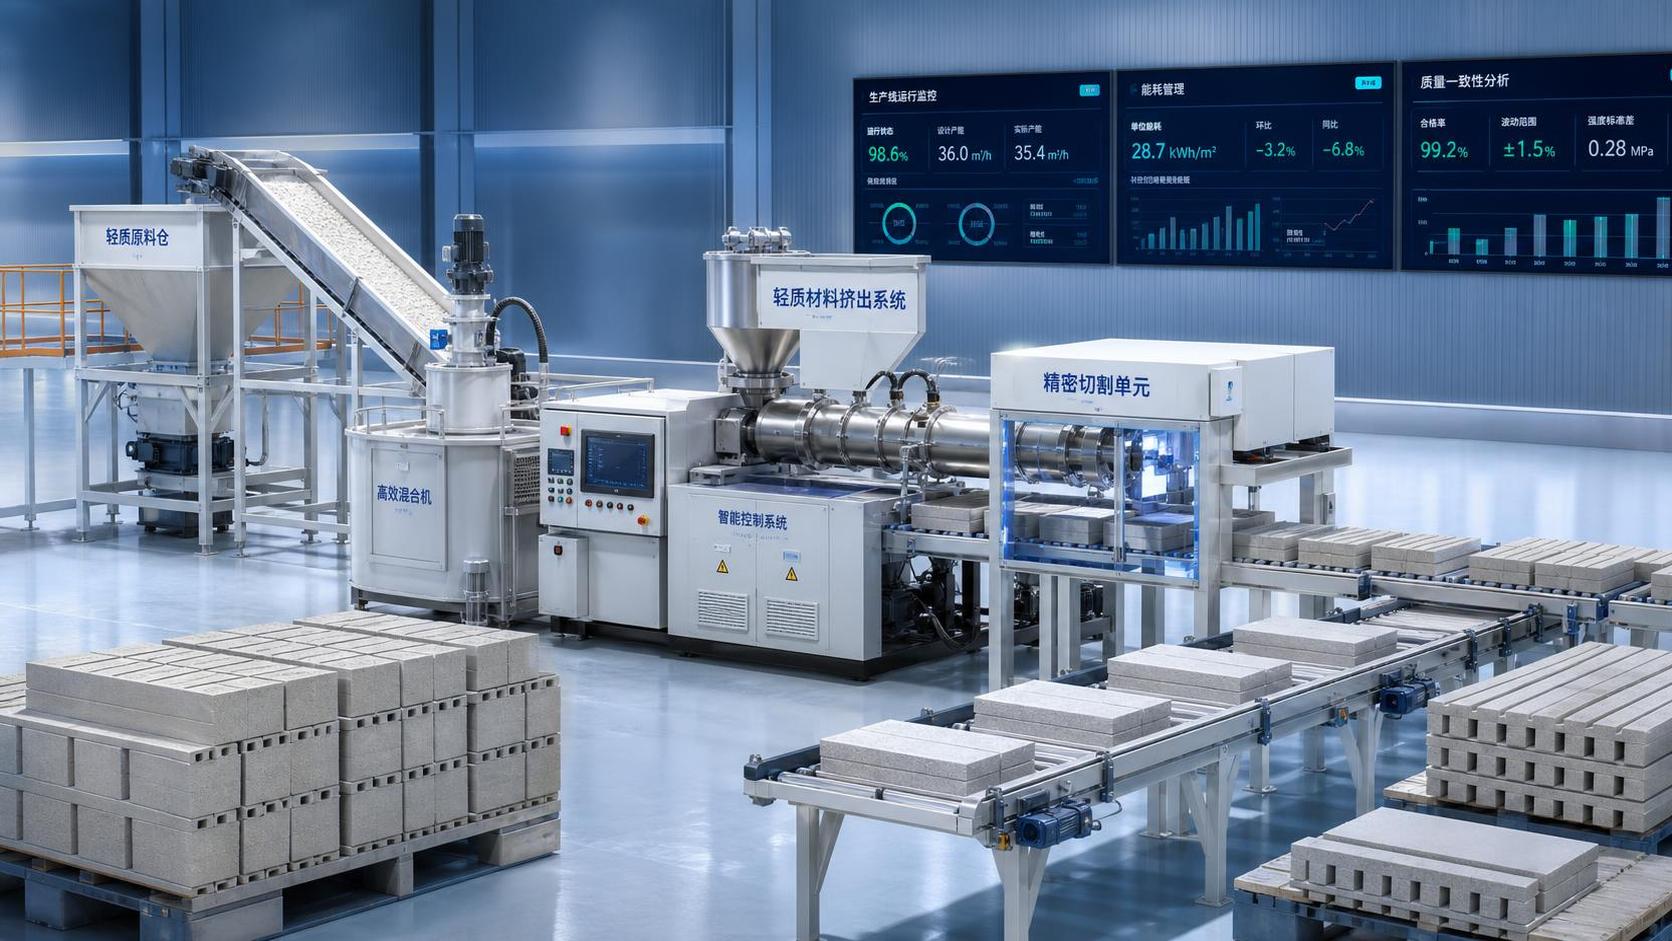
Similar dependencies appear in material extrusion. Feed preparation, moisture control, mixing quality, die condition, forming pressure, cutting, drying, and curing or firing must be read as one chain. Increasing extruder output can create downstream drying constraints. A change in formulation may alter die wear, green strength, drying shrinkage, or rejection rates. The appropriate engineering response is rarely to optimize a single machine in isolation.
Project teams should examine each important handoff through a small set of practical tests:
- Does the receiving stage have a defined and measurable acceptance condition?
- Can upstream variation be detected before it creates a downstream quality, safety, or environmental problem?
- Is there enough buffering capacity, or will a short interruption force a full-line slowdown or shutdown?
- Who owns the response when operating conditions leave the normal range?
- Can personnel inspect, isolate, clean, or repair the interface without exposure to heat, dust, confined spaces, moving equipment, or uncontrolled releases?
These questions often reveal that the process problem is also an organizational one. A plant can have well-designed equipment yet remain vulnerable when responsibilities are unclear across production, maintenance, laboratory, environmental, and engineering teams.
Do Not Treat Safety as a Separate Overlay
Safety studies are essential, but safety should also be embedded in the process map itself. A hazard register prepared after the process design is substantially fixed may identify exposures that have become expensive to address. Mapping hazards alongside routine operating steps makes it easier to design out risk while alternatives are still open.
For thermal processes, the map should clearly mark heat sources, pressure boundaries, combustible dust zones, fuel systems, hot-material transfer points, emergency isolation locations, exhaust pathways, access routes, and maintenance tasks that require the process to be in a particular state. The same principle applies to chemical additions, hydraulic systems, high-voltage equipment, and automated handling equipment.
One recurring mistake is to evaluate safety only during steady-state production. Start-up, warm-up, shutdown, cleaning, upset recovery, and refractory repair can involve different energy states and different exposure patterns. If these modes are absent from the map, the project may design for a condition that occupies only part of the plant’s operating life.
A process map should therefore distinguish between the normal route and the exceptional routes. It should show bypasses, recirculation paths, manual feed methods, temporary storage, emergency venting, off-spec product handling, and controlled shutdown sequences where relevant. These are not peripheral details. They determine whether a disruption is contained or becomes a prolonged operational event.
Use the Map to Separate Constraints From Symptoms
Plants frequently experience recurring symptoms: unstable throughput, high fuel use, excessive carryover, product defects, frequent trips, filter loading, uneven temperature profiles, or unplanned maintenance. The visible symptom may be far from the constraint that drives it.
Industrial process engineering helps project teams avoid investing in the wrong remedy by testing the full cause-and-effect path. A production limit should be examined against material properties, equipment duty, control limits, utility availability, maintenance condition, and downstream capacity. A change should also be assessed for what it displaces. Raising a setpoint, increasing fan capacity, accelerating a conveyor, or adding a fuel source may solve one limitation while creating another.
The value of this approach is not that every issue receives a complex model. It is that capital decisions are linked to a defensible operating hypothesis. A project leader can then ask whether the proposed solution addresses the constraint, accommodates normal variation, and remains maintainable over the equipment life cycle.
Build a Map That Can Survive Commissioning
A process map created for early feasibility work should evolve as the project advances. At concept stage, it may identify major flows, operating envelopes, and obvious integration points. During basic engineering, it should define control points, utilities, design cases, maintenance access, emissions pathways, and interlocks. Before commissioning, it should support operating procedures, alarm rationalization, training, acceptance testing, and troubleshooting.
The map loses value when it is treated as a handover document rather than a working reference. Operations personnel, maintenance specialists, process engineers, automation engineers, environmental staff, and safety leads each see different failure modes. Their review is most effective when they can challenge the same process representation rather than interpret disconnected drawings and spreadsheets.
Digital tools can make this work more accessible, especially when process data, equipment condition, laboratory results, and energy information can be linked to the mapped flow. But a digital twin or dashboard does not compensate for weak process boundaries or unclear engineering assumptions. The useful sequence is to establish the operating logic first, then use data systems to validate and improve it.
For project leaders, the final test is straightforward: can the team explain what happens when conditions depart from plan, who acts, which limits matter, and where a change will affect the rest of the plant? When the map can answer those questions, it has moved beyond documentation. It becomes a practical basis for safer design choices, more resilient operations, and efficiency improvements that do not simply transfer risk elsewhere in the process.
Related News
 Dr. Alistair VaughnIndustrial Process Engineering: How to Map Processes for Safer, More Efficient PlantsIndustrial process engineering reveals bottlenecks, safety risks, and energy losses through practical process mapping for safer, more efficient plants.Sep 09, 2026
 Optical Glass Tech FellowHow to Evaluate a Glass Annealing Equipment Manufacturer for Production StabilityChoose a glass annealing equipment manufacturer with proven thermal uniformity, reliable controls, lifecycle value, and responsive service for stable production.Sep 08, 2026
 Prof. Marcus ChenThermal Energy Architecture in North America: Strategies for Lower Building Energy UseThermal energy architecture North America helps project leaders cut building energy use through stronger envelopes, right-sized HVAC, storage, and smart commissioning.Sep 07, 2026
 Ms. Elena RodriguezHow Should Buyers Evaluate Building Material Industry Intelligence Pricing?Building material industry intelligence pricing: learn how to compare coverage, technical depth, and ROI to choose intelligence that reduces procurement risk.Sep 07, 2026
 Ms. Elena RodriguezHow to Use Building Material Intelligence Data for Market and Investment DecisionsBuilding material industry intelligence data helps leaders evaluate demand, costs, regulation, capacity, and technology to make smarter market and investment decisions.Sep 05, 2026
 Thermal Energy ArchitectHow PLC Control Improves Energy Efficiency and Temperature Stability in KilnsEnergy efficient kilns PLC control improves temperature stability, cuts fuel waste, and optimizes combustion, draft, and material flow. Explore proven strategies for smarter kiln modernization.Sep 04, 2026
 Optical Glass Tech FellowEuropean Glass Melting Processes: Furnace Choices, Energy Use, and Quality ControlGlass melting process Europe: explore furnace choices, energy efficiency, cullet strategy, and quality control to improve output, compliance, and long-term glass performance.Sep 03, 2026
 Thermal Energy ArchitectWhat Determines Refractory Lining Monitoring Price for Industrial Kilns?Refractory lining monitoring price depends on kiln size, sensor technology, installation, software, and support. Compare total lifecycle costs and choose the right solution.Sep 02, 2026
 Silicate Process EngineerCement Production System Costs: A Plant Buyer’s Guide to Budgeting and ROICement production systems cost planning made clear: compare CAPEX, operating costs, compliance, and ROI to build a resilient, profitable cement plant investment.Sep 01, 2026
 Dr. Alistair VaughnWhat Should a Process Technology Database Track for High-Temperature Plants?Process technology database essentials for high-temperature plants: track thermal profiles, feed chemistry, refractory wear, emissions, energy, and maintenance for safer, data-driven decisions.Aug 31, 2026
 Ms. Elena RodriguezHow to Evaluate a Silicate Processing Equipment Manufacturer for Plant ProjectsSilicate processing equipment manufacturer selection: assess process fit, guarantees, energy, compliance, delivery risk, and lifecycle support for dependable plant performance.Aug 30, 2026
 Dr. Alistair VaughnHow to Specify Custom Agricultural Processing Equipment for Throughput and HygieneEquipment customization services for agricultural processing: learn to specify hygienic, high-throughput lines that improve yield, reliability, and long-term efficiency.Aug 29, 2026
 Dr. Alistair VaughnHow to Select Process Plant Equipment for High-Temperature, Abrasive Production LinesProcess plant equipment selection for high-temperature, abrasive lines: reduce downtime, improve durability, and optimize lifecycle performance.Aug 28, 2026
 Silicate Process EngineerHow Kiln Heat Recovery Systems Cut Fuel Use in Cement and Lime ProductionKiln heat recovery helps cement and lime plants cut fuel use, improve thermal stability, and build practical, reliable decarbonization strategies.Aug 27, 2026
 Ms. Elena RodriguezProcess Equipment Comparison: Which Metrics Matter Most for Reliable Selection?Process equipment comparison made practical: discover which metrics truly drive reliable selection, from energy efficiency and control stability to wear life, maintainability, and uptime.Aug 26, 2026
 Ms. Elena RodriguezWhat Buyers Should Check Before Sourcing Precision Alloy Bars for Critical PartsPrecision Alloy Bars buyers should verify grade, chemistry, tolerances, surface quality, traceability, and lead time before sourcing for critical parts. Learn what prevents costly machining and reliability risks.Aug 27, 2026
 Ms. Elena RodriguezHow to Evaluate Thermal Management Solutions Insulation for High-Heat Industrial SystemsThermal management solutions insulation: learn how to assess high-heat industrial systems by thermal performance, durability, lifecycle cost, and supplier data for smarter decisions.Aug 25, 2026
 Ms. Elena RodriguezWhat Drives Waste Recycling Cost in Industrial Projects and How to Estimate It?Waste recycling cost in industrial projects depends on composition, moisture, transport, pre-treatment, and compliance. Learn how to estimate it accurately and compare suppliers with confidence.Aug 24, 2026
 Silicate Process EngineerHow to Evaluate Cement Production Plants in the Middle East for Capacity, Fuel Flexibility, and ROIcement production plants Middle East: Learn how to assess true capacity, fuel flexibility, and ROI risks to identify resilient assets and smarter investment opportunities.Aug 23, 2026
 Structural Material AnalystHow to Evaluate Lightweight Material Machinery for Output, Energy Use, and Product QualityLightweight material machinery evaluation guide: compare stable output, energy use, and product quality to choose equipment that cuts waste, lowers costs, and improves production confidence.Aug 22, 2026




Related News
- 00
0000-00
Industrial Process Engineering: How to Map Processes for Safer, More Efficient Plants - 00
0000-00
What Should a Process Technology Database Track for High-Temperature Plants? - 00
0000-00
How to Specify Custom Agricultural Processing Equipment for Throughput and Hygiene - 00
0000-00
How to Select Process Plant Equipment for High-Temperature, Abrasive Production Lines - 00
0000-00
What Causes Thermal Shock Failure in Heat-Resistant Materials During Development?
Weekly Insights
Stay ahead with our curated technology reports delivered every Monday.