
What Is a Realistic Energy Efficiency Target for a Cement Plant?




“What energy efficiency target is realistic for a cement plant?” is rarely a question with one clean number as an answer. A plant manager may be under pressure to cut fuel costs, a sustainability team may need a credible decarbonization plan, and an investor may want to compare facilities across regions. Yet two plants producing the same annual cement volume can have very different energy profiles—and both may be operating reasonably well within their own technical limits.
A realistic target must begin with the plant’s current condition: kiln configuration, raw material moisture, alternative fuel availability, clinker-to-cement ratio, grinding circuit, production stability, and the reliability of core assets. The most useful target is not “reduce energy by 20%” in isolation. It is a phased, measurable improvement pathway covering thermal consumption, electrical power, clinker factor, downtime, and emissions intensity.
For most operators, the practical objective is to close the gap between current performance and the achievable benchmark for their process—not to chase a theoretical best case that depends on conditions the plant does not have.
Start by separating thermal and electrical efficiency
Energy performance in cement cannot be understood through a single plant-wide figure. Fuel used in clinker production and electricity used in grinding, conveying, crushing, fans, packing, and auxiliaries behave differently. They are influenced by different equipment, control strategies, and bottlenecks.
Thermal energy is commonly measured in gigajoules per tonne of clinker (GJ/t clinker), while electrical energy is often reported in kilowatt-hours per tonne of cement (kWh/t cement) or, in some reviews, per tonne of clinker. Comparing these indicators without confirming their basis is one of the most common sources of misleading conclusions.
A modern dry-process plant may have good kiln thermal performance but relatively high electrical demand because it produces high-strength, finely ground cement. Another plant may show low electricity consumption per tonne of cement while consuming excessive fuel in the kiln. A credible energy roadmap has to see both realities.
What energy efficiency target is realistic for a cement plant?
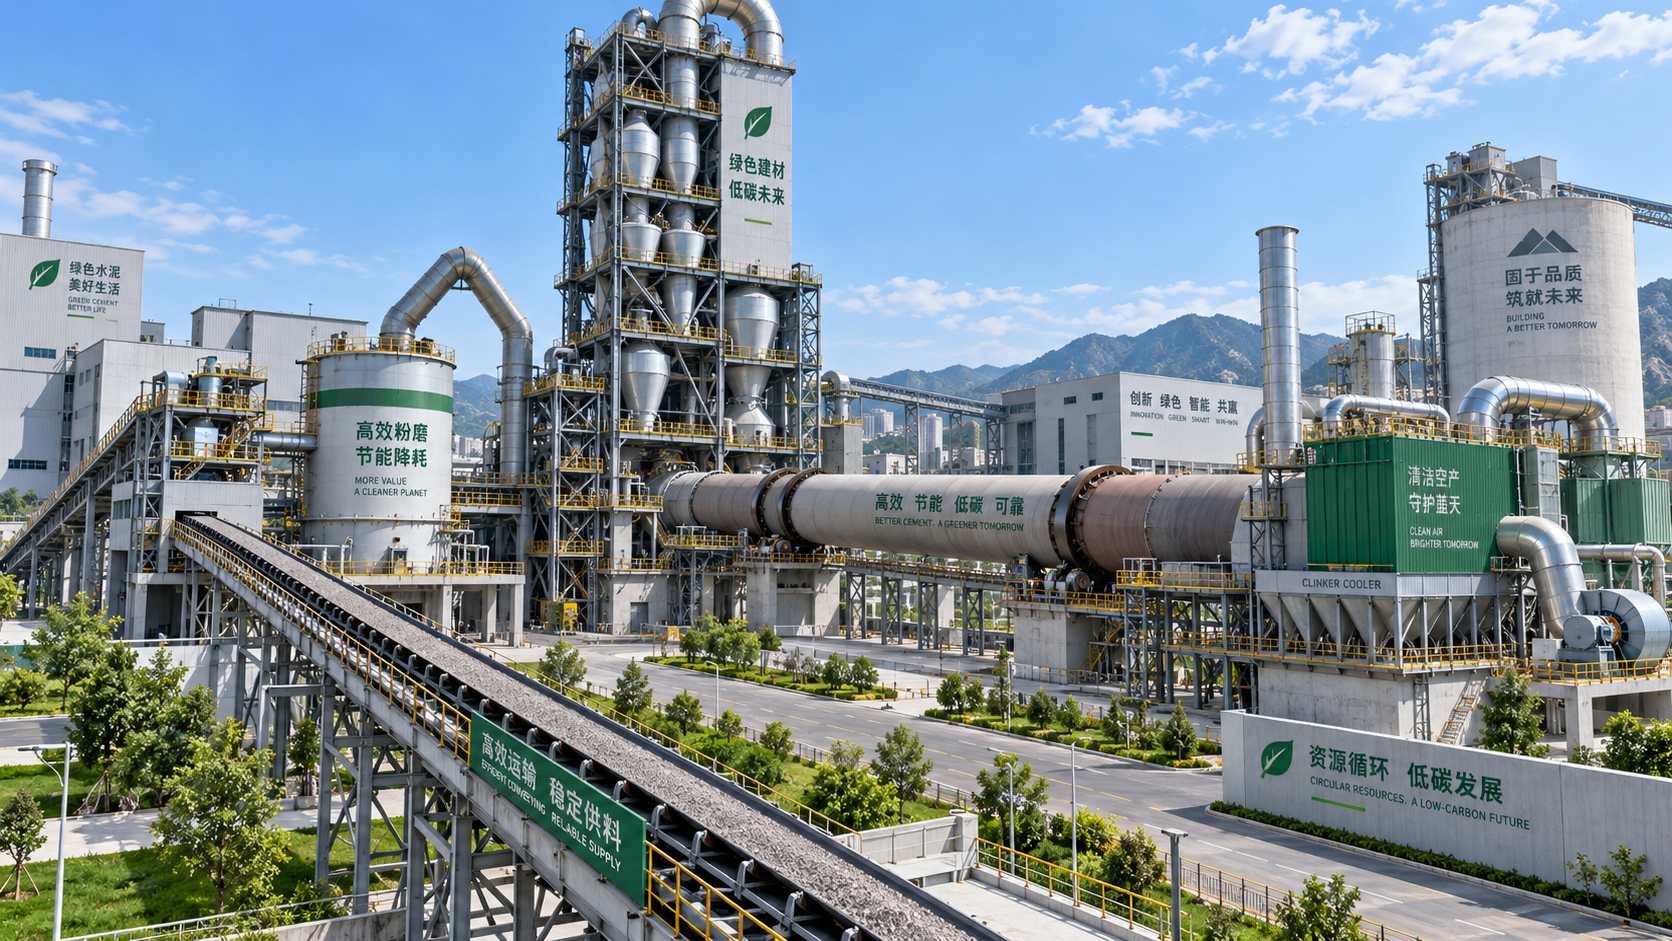
For a well-operated modern dry-process plant with a multi-stage preheater and precalciner, a realistic medium-term thermal target is often in the range of 3.3 to 3.6 GJ per tonne of clinker, assuming stable raw materials, controlled moisture, sound refractory practice, and a dependable fuel system. Plants already operating near this range may still find incremental gains, but they should be cautious about promising dramatic reductions without major equipment changes.
For dry-process plants operating around 3.7 to 4.1 GJ/t clinker, a reduction of roughly 5% to 12% can often be a reasonable planning range. The opportunity may come from heat-loss control, kiln stability, improved cooler operation, reduced false air, better combustion management, and fewer unplanned stops. Whether the plant reaches the lower end or upper end of that range depends on how much of the current loss is operational rather than structural.
Where thermal energy consumption exceeds 4.1 GJ/t clinker, the first target should usually be diagnostic rather than aspirational: identify why. High raw material moisture, an inefficient cooler, poor heat exchange, frequent kiln disturbances, degraded refractory lining, limited preheater capacity, or inconsistent fuel can each explain the gap. Some issues can be corrected through operational discipline. Others require capital expenditure and a longer investment horizon.
Older wet-process and long dry kilns should not be judged directly against the performance of modern preheater-precalciner lines. They may achieve operational improvements, but their design imposes a different energy floor. In these cases, the realistic question becomes whether targeted upgrades can deliver enough savings to justify continued operation, or whether the broader economics point toward kiln replacement, conversion, or capacity consolidation.
On the electrical side, many integrated cement plants aim for approximately 85 to 110 kWh per tonne of cement, although the meaningful range can be wider. Cement fineness, grinding technology, additives, raw material grindability, plant layout, and product portfolio matter greatly. A plant producing ordinary Portland cement and one producing high-blain specialty cement should not be expected to have the same power demand.
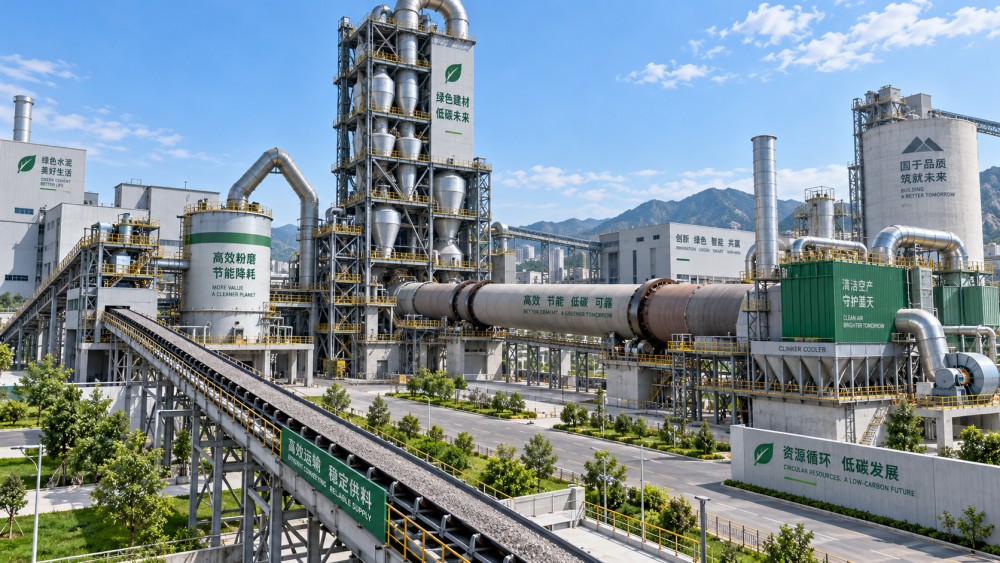
A comparison that prevents unrealistic targets
The table below offers a practical way to classify starting positions. These are directional benchmarks for planning and comparison, not universal guarantees. Site-specific testing remains essential.
This comparison also explains why board-level targets should be expressed in layers. A near-term operating target may be a 3% reduction in thermal specific energy. A two-year reliability target may seek fewer kiln stops and a narrower heat-consumption variance. A longer-term carbon target may depend on lower clinker content, alternative fuels, renewable electricity, or carbon capture—measures that do not all appear in the same energy meter.
The “per tonne of cement” trap
Energy intensity per tonne of cement is commercially important, but it can improve even when kiln efficiency does not. If a producer lowers its clinker factor by incorporating limestone, calcined clay, slag, fly ash, or other approved supplementary materials, less clinker energy is allocated to each tonne of cement. That is generally positive from a carbon and resource perspective, but it should not be confused with a better-performing kiln.
Conversely, a plant may increase its electrical consumption per tonne of cement because it produces a finer, higher-value product or because it introduces a supplementary material that requires additional grinding. The added electricity may be justified if total lifecycle emissions, market value, and product performance improve.
For this reason, leading reviews use at least three linked indicators:
- Thermal energy consumption per tonne of clinker;
- Electrical energy consumption per tonne of cement;
- CO₂ intensity per tonne of cementitious product, with clinker factor clearly disclosed.
When these metrics move together, the management team can distinguish genuine process improvement from a shift in product mix.
Where the most realistic savings usually come from
In many cement plants, the first savings are not hidden in a dramatic technology announcement. They are found in the daily behavior of the pyroprocess system. A kiln that runs steadily is almost always more efficient than one that repeatedly swings between unstable coating, high free lime, cooler upset, and emergency intervention.
False air control is a familiar example. Air leakage into the preheater, kiln hood, and ductwork raises fan load and dilutes useful process gases. The effect may appear modest in a single inspection, yet over thousands of operating hours it can undermine both fuel efficiency and electrical performance.
Clinker cooler performance deserves the same attention. A weak cooler sends recoverable heat out through the stack or clinker discharge rather than returning it to the kiln system as secondary and tertiary air. Cooler optimization can also influence clinker temperature, downstream conveying, and refractory stress.
Fuel consistency becomes especially important as plants increase alternative fuel substitution. Alternative fuels can lower fossil-carbon exposure and support circularity, but inconsistent particle size, moisture, calorific value, or feeding location may destabilize the flame and increase specific heat consumption. The goal is not simply the highest substitution rate. It is the highest stable substitution rate compatible with kiln operation, emissions control, clinker quality, and maintenance limits.
Grinding circuits remain a major electrical opportunity. Separator efficiency, mill ventilation, grinding media condition, roller pressure, feed consistency, and fan control all influence kWh per tonne. A power-saving project should be judged against cement quality and throughput, not solely against instantaneous power draw. Reducing mill power while sacrificing output often creates a false victory.
Set targets in phases, not slogans
A useful energy plan often has three horizons. The first 90 days should focus on establishing trustworthy baselines: calibrated meters, agreed production definitions, shift-level data, and a record of abnormal events. Without this, a plant may spend months debating whose number is correct rather than improving performance.
The next 6 to 12 months can target controllable losses. This includes combustion tuning, false-air surveys, cooler audits, preventive maintenance, variable-speed-drive logic, fan optimization, and training for control-room teams. Targets in this phase should be specific enough to manage: reduce thermal specific energy by a defined amount, narrow daily variation, cut fan power, or improve run factor.
The longer horizon addresses constraints that cannot be solved from the control room: preheater upgrades, cooler retrofit, waste heat recovery, high-efficiency grinding, digital process models, alternative-fuel handling, and lower-clinker cement strategies. These investments need a different business case because their value reaches beyond direct fuel savings. They may improve resilience against carbon pricing, fuel volatility, or tightening environmental requirements.
Do not let a single average hide poor operating discipline
Monthly averages are useful, but they can conceal expensive instability. A plant may report a respectable monthly thermal figure while suffering repeated periods of high fuel consumption after kiln stops, snowman formation in the cooler, coating collapse, or raw mill interruptions. These events consume energy, disrupt output, and place strain on equipment and people.
Track the distribution behind the average. How many days operate within the desired energy band? What happens after a fuel change? Does energy rise during rainy-season raw material handling? How much consumption is associated with start-ups and shutdowns? These questions turn an abstract benchmark into an operating management tool.
For high-temperature industries, this is where process intelligence becomes more than reporting. Connecting thermal parameters, kiln chemistry, refractory behavior, maintenance records, emissions data, and production quality creates a clearer picture of cause and effect. It also helps technical teams explain why a proposed target is attainable—or why it is not yet defensible.
A balanced answer for decision-makers
So, what energy efficiency target is realistic for a cement plant? For a modern dry-process facility, a thermal ambition around 3.3–3.6 GJ/t clinker is a sensible reference range, while electrical performance should be benchmarked against the plant’s product mix and grinding configuration rather than a universal number. Plants with higher consumption should normally pursue a staged reduction plan, often beginning with 5%–12% where clear operational losses exist.
The strongest target is neither timid nor theatrical. It reflects the actual kiln line, recognizes the difference between clinker and cement metrics, and assigns ownership to the improvements that make the number possible. In a sector where every tonne carries energy, carbon, and infrastructure value, that kind of disciplined target is far more useful than a headline percentage.
Related News
 Dr. Alistair VaughnIndustrial Waste Recycling: Selecting Conversion Systems by Feedstock and OutputCompare industrial waste conversion systems recycling teams can match to feedstock and output. Explore recovery routes, quality criteria, and costs to choose with confidence.Oct 14, 2026
 Ms. Elena RodriguezHigh-Pressure Molding Innovations: How Automation and Tooling Affect PriceExplore the high-pressure molding innovations price equation: compare automation, tooling, and ownership costs to find upgrades that cut waste and deliver measurable value.Oct 13, 2026
 Ms. Elena RodriguezIndustrial Process Optimization: Where to Target Energy, Yield, and Throughput LossesIndustrial process optimization: identify energy, yield, and throughput losses to improve plant stability, reduce costs, and unlock measurable performance gains.Oct 12, 2026
 Ms. Elena RodriguezGlass Market Intelligence: How to Assess Demand, Capacity, and Regional Growth RisksGlass market intelligence for evaluating demand, effective capacity, energy exposure, trade dynamics, and regional growth risks before investing in glass manufacturing.Oct 11, 2026
 Silicate Process EngineerWhat Is a Realistic Energy Efficiency Target for a Cement Plant?What energy efficiency target is realistic for a cement plant? Explore practical thermal and electrical benchmarks, savings opportunities, and phased strategies to reduce costs, improve reliability, and build a credible decarbonization roadmap.Oct 14, 2026
 Ms. Elena RodriguezAre Green Building Materials More Expensive to Manufacture?Are green building materials more expensive to manufacture? Explore cost drivers, savings opportunities, and how sustainable production can strengthen long-term competitiveness.Oct 13, 2026
 Structural Material AnalystWhich Sustainable Construction Materials Are Suitable for Extrusion?Which sustainable construction materials are suitable for extrusion? Explore recycled clay, cementitious mixes, geopolymers, and bio-composites for reliable, lower-impact building products.Oct 12, 2026
 Optical Glass Tech FellowWhat Should a Glass Furnace Energy Specification Include?What should be included in a glass furnace energy specification? Explore performance, fuel flexibility, heat recovery, emissions, and monitoring essentials.Oct 11, 2026
 Dr. Alistair VaughnHow Process Technology Platforms Improve Control Across Multi-Line ManufacturingDiscover how a process technology platform strengthens cross-line control, connects operational data, and improves energy, quality, and maintenance decisions.Oct 10, 2026
 Optical Glass Tech FellowHow Glass Furnace Emissions Are Measured and Controlled for Regulatory ComplianceGlass furnace emissions: learn how to measure, monitor, and control NOx, SOx, particulate, CO, and CO2 for reliable regulatory compliance.Oct 08, 2026
 Prof. Marcus ChenIndustrial Decarbonization Strategies in Europe: A Roadmap for Energy-Intensive PlantsIndustrial decarbonization strategies Europe: explore practical pathways for energy-intensive plants to cut emissions, improve efficiency, and protect performance.Oct 07, 2026
 Thermal Energy ArchitectEnergy-Efficient Silicate Production Lines: What to Compare Before SelectionSilicate production lines energy efficient selection guide: compare thermal performance, stability, emissions, controls, and lifecycle value before investing.Oct 06, 2026
 Optical Glass Tech FellowHow to Evaluate Automated Float Glass Lines for Capacity, Quality, and Energy UseEvaluate automated float glass lines for net capacity, consistent quality, energy efficiency, automation reliability, and lifecycle value. Explore key criteria for smarter investment decisions.Oct 05, 2026
 Thermal Energy ArchitectWhat Does CE Marking Require for an Energy-Efficient Industrial Kiln?Energy efficient kiln CE requirements explained: assess safety, technical files, energy performance, and EU compliance before purchase or commissioning.Oct 04, 2026
 Thermal Energy ArchitectRefractory Manufacturing Solutions for Brick Plants: How to Extend Kiln LifeRefractory manufacturing solutions for brick plant operations: discover proven strategies to extend kiln life, reduce heat loss, prevent lining failures, and plan cost-effective repairs.Oct 03, 2026
 Thermal Energy ArchitectHow to Specify Heavy Industrial Process Systems for High-Temperature PlantsHeavy industrial processes systems: learn how to specify high-temperature plants for efficiency, emissions control, maintainability, and lifecycle performance.Oct 02, 2026
 Structural Material AnalystHow Sustainable Material Extrusion Can Improve Wall Panel Durability and Design FlexibilityDiscover how sustainable material extrusion for wall panels improves durability, moisture resistance, design flexibility, and installation consistency for high-performing wall systems.Oct 01, 2026
 Thermal Energy ArchitectHow to Evaluate a High-Temperature Materials Manufacturer for Furnace ApplicationsChoose a high-temperature materials manufacturer with confidence: compare thermal performance, chemical resistance, quality controls, installation support, and lifecycle cost.Sep 30, 2026
 Ms. Elena RodriguezHow to Structure Global Specification Data for Faster Industrial Product EvaluationGlobal specification-oriented product information helps industrial teams compare capacity, energy, emissions, automation, and lifecycle data on a like-for-like basis for faster, confident equipment decisions.Sep 29, 2026
 Thermal Energy ArchitectHow to Specify High-Temperature Process Systems for Continuous Thermal OperationsHigh-temperature process engineering systems: learn how to specify resilient continuous thermal operations for efficiency, compliance, reliable uptime, and long-term performance.Sep 28, 2026



Related News
- 00
0000-00
What Is a Realistic Energy Efficiency Target for a Cement Plant? - 00
0000-00
How Latin American Cement Plants Can Reduce Dust Emissions in Kilns and Transfer Points - 00
0000-00
Cement Plant Emission Control: Selecting Systems for Dust, NOx, and SO2 Limits - 00
0000-00
Cement Production System Costs: A Plant Buyer’s Guide to Budgeting and ROI - 00
0000-00
How Kiln Heat Recovery Systems Cut Fuel Use in Cement and Lime Production
Weekly Insights
Stay ahead with our curated technology reports delivered every Monday.